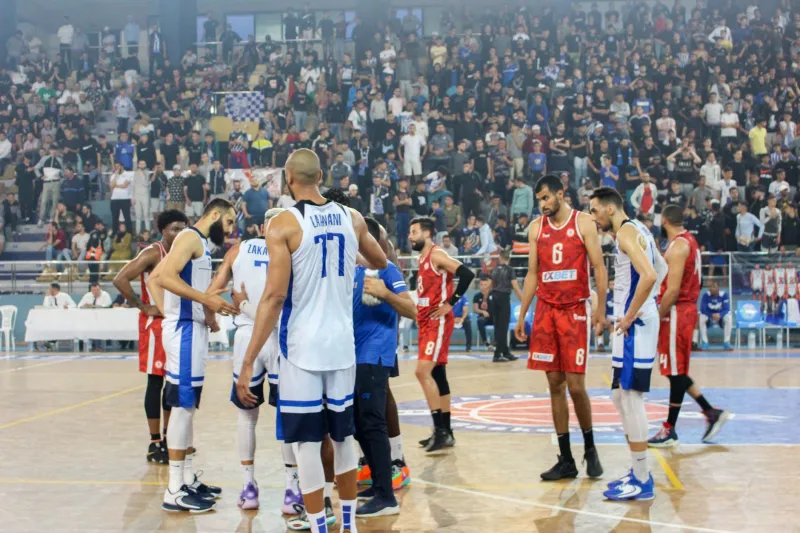
Five FIBA Numbers That Survive Customs — And Three That Don't

Photo by Photo by Egor Komarov on Unsplash on Unsplash
Every summer, a front office talks itself into a number. Twenty-two points a game in a European league. Forty percent from three. A highlight reel of steals. Then the player arrives, the pace changes, the whistle changes, the line moves back, and the number turns out to have been a rumor.
Scouting departments have gotten smarter about this, mostly out of self-defense. What follows is not proprietary — it is the rough consensus of the analysts and international scouts who do this for a living, translated out of spreadsheet dialect.
First, Why Every Box Score Shrinks at the Airport
NBA games run roughly 99 possessions. A lot of FIBA qualifiers and European club games sit in the low-to-mid 70s. That is a quarter of the game missing. A guy averaging 16 points overseas is not necessarily worse than a guy averaging 20 in the NBA — he just got fewer chances to do anything.
So the first rule of international stat translation: never compare raw totals. Convert everything to a rate — per 40 minutes, per 100 possessions, or as a percentage of team opportunities. Then compare.
With that out of the way, here is what travels.
1. Free-Throw Rate and Fouls Drawn Per 40
Fouls drawn is one of the stickiest numbers in the sport. It reflects aggression, balance, and a feel for contact that does not disappear when the competition gets better. FIBA's game is more physical in the paint and less generous on the perimeter, so a player who still lives at the line in a qualifier is doing something real.
Watch for the big man drawing five-plus fouls per 40 in a league where the refs swallow the whistle. That translates into easy points and opponent rotation problems almost immediately.
2. Pace-Adjusted Rebound Percentage
Raw rebounding averages are the single most inflated stat in international basketball, because a 72-possession game creates fewer misses to chase and a shorter court shrinks the space. What survives the trip is rebound percentage — the share of available boards a player grabs while he is on the floor.
A guard who posts a 12 percent defensive rebound rate overseas is a real rebounder. A center who posts 22 percent is a rotation player. The totals will look tiny in a box score; the rate tells the truth.
3. Half-Court Two-Point Accuracy
This one requires tape, not a spreadsheet. FIBA's pace creates transition chances that disappear in the NBA's set-defense world, so a 55 percent two-point shooter may actually be a 45 percent shooter once the easy ones are stripped out.
Analysts now split the number into rim attempts and everything else, and then split again by half-court versus transition. The players whose half-court rim rate holds steady are the ones who stick.
4. Ball-Screen Assist-to-Turnover
Assist totals are noisy at low pace. The more useful version is decision quality in the pick-and-roll: assists against turnovers specifically in ball-screen actions, ideally weighted by how often the player is blitzed.
A point guard who keeps a 3-to-1 ratio in those situations against aggressive FIBA coverages is usually fine in the NBA. A guard who feasts on drive-and-kick against a sagging defense is a coin flip.
5. Defensive Foul Rate (Read In Reverse)
This is the stat teams use to talk themselves out of a player, and it deserves the spotlight. FIBA referees call the game differently — more tolerance inside, less tolerance for hand-checks and flopping. A big man committing six fouls per 40 overseas will not magically become disciplined in the NBA.
Analysts who like a prospect will forgive a lot. They will not forgive a guy who cannot stay on the floor, because availability is the whole job.
The Three Mirages
Raw points per game is the first. It is a function of usage and pace more than quality, and no experienced scout quotes it without a caveat.
Steals are the second. High steal totals in a league with loose ball handling and slow decision-making say more about the league than the defender. The per-minute version tells you he gambles; the eye test tells you whether the gamble pays.
Three-point percentage is the third, and it is the sneakiest. The FIBA arc sits at 6.75 meters with corners at 6.60, compared to 7.24 and 6.70 in the NBA. That extra half-meter matters, especially for a player whose release is slow. A 40 percent shooter on two attempts a game from a shorter line is not the same asset as a 37 percent shooter on six attempts from the NBA distance. Volume plus distance plus release speed is the actual number.
How to Use This Without a Data Team
If you are a fan trying to evaluate the international guy your team just signed, do three things. Find his per-40 numbers, not his averages. Find out what league he played in and how fast it plays. And then find one full game, not a highlight package, and watch whether he is on the floor in the last three minutes.
That last one is not a stat. It is better than one.